Public vs Private Markets
As can be seen on our website, we’ve stated that we do very little in the private markets, except for reverse inquiries. There are a number of reasons for this including a lack of edge when it came to deal-flow, skepticism over return calculations, and general illiquidity. That said, we’ve never really put too much work into backing up our assumptions, but lucky for us, a new paper published by Morgan Stanley last month backed up a lot of our beliefs using data. The paper, written by Michael Mauboussin and Dan Callahan, can be read in its entirety here. We highly recommend you read it (or at least skim it) but we will summarize what we thought were the most interesting parts for you. Do note that notwithstanding anything we discuss below, we are not saying private markets are a bad place to invest, and in fact, many endowments are increasing their allocation to the asset class given the low returns in fixed income. We just feel like with any asset class, it’s best to have all the facts in front of you before investing. Lastly, in case reading is not for you, the Invest like the Best podcast had Michael Mauboussin on to talk about the paper, you can listen to it here.
The Big Shift
A common topic in the subject of public and private markets is the shift from equity investing in public markets to private markets (especially in the US market, which this paper focuses on). During the mid to late 2010s it seemed to us that there was a new unicorn being created every other day and companies were staying private for longer. To a certain extent this is true as we’re seeing far fewer IPOs now than we did in the 80’s and 90’s.

This also came with the sense that private markets were/are more in vogue and that funding was shifting that way, and almost everyone you talk to was getting involved in early-stage investing. This hypothesis is confirmed by a study of investment flows, with flows into equity mutual funds and ETFs declining over the last couple years.

… and flowing into private markets.

Size of the markets
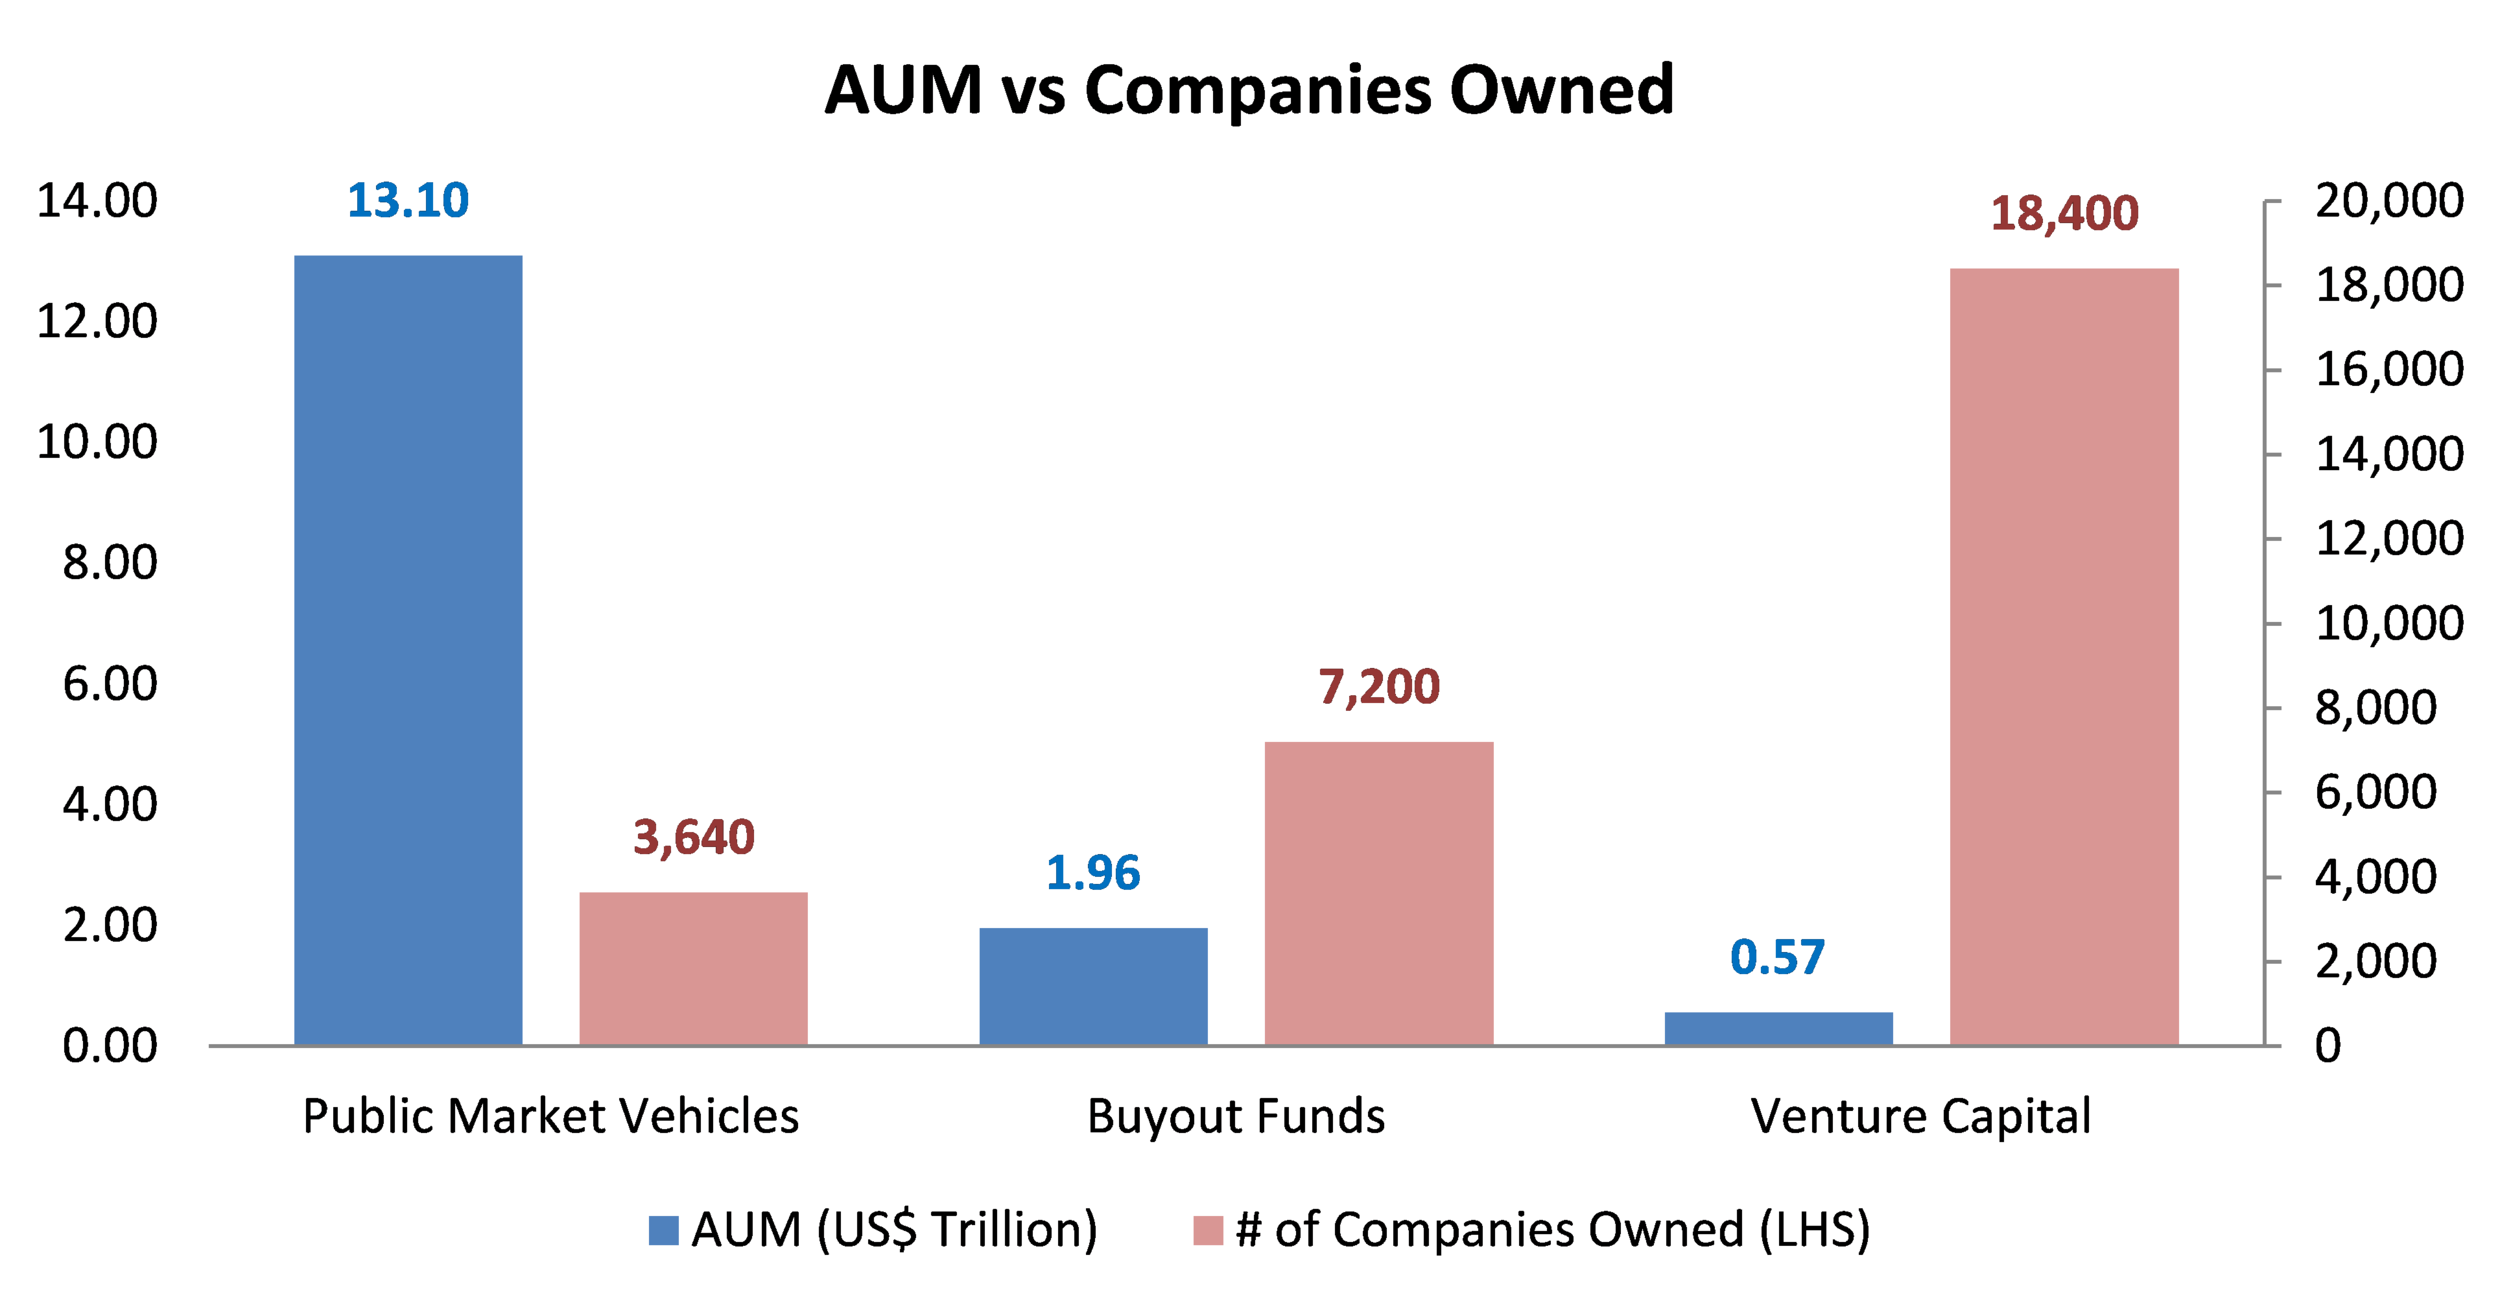
As at the end of 2019 there are ~3,640 public firms in the US, 7,200 firms owned by buyout funds and 18,400 companies backed by venture firms. With this split, you would think the funding breakup would be tilted toward the private markets. However, this is far from the truth. In fact, Public Funds/ETFs/Hedge Funds/SMAs account for ~$13.1 trillion in assets versus ~$2 trillion for buyout funds and $565 billion for venture capital[1]
Re-evaluating Returns
Now, the key belief that market participants have is that buyout and venture capital funds provide outsized returns versus public markets, and the chart below shows that this could potentially be true with buyout funds providing 5-8% higher annual returns versus public markets, and venture capital providing 10-12% higher returns.

However, these returns have been met with a lot of scepticism as typical buyout and VC funds present returns on an IRR basis which can overstate actual returns depending on the nature of the pay-outs. We wrote a previous blog about how IRR can be manipulated in this blog post. But just to give you one small way IRR can be manipulated, the paper highlights a common practice of using lines of credit.
“Some fund managers have sought to enhance their IRRs by using subscription lines of credit. Instead of calling capital directly from limited partners, the general partner borrows money from a bank. Shortening the time that the capital of the limited partners is invested boosts the IRR. These lines of credit have gone from a fairly modest $150 million in 2014 to about $20 billion in 2019 and increased the annualized IRRs by 2.6 percentage points for the funds that used them”
The reality is because of how IRR can be misleading and MOIC (Multiple on Invested Capital) is also not entirely accurate, researchers have come up with a benchmark called Public Market Equivalent (PME) to compare returns between VC, Buyout, and public markets. A PME of 1 for an asset class means returns from that asset class were equivalent to that of public markets during the same time period. We can see how Buyout and VC returns compare on a PME basis.


As you can see, this data cuts off around 2015 for the buyout funds and 2013 for the VCs as researchers have not included funds that have not fully divested. But you do get a certain sense of the returns. For Buyout funds the PME is around 1.1-1.2x whereas for VC is ~1.3x for the whole period. While this shows that perhaps these two asset classes do perform better than public markets, we wonder if the difference is enough to justify the illiquidity of the VC and buyout investments.
If you look closely at the two graphs, you’ll notice that giving you a PME figure for the whole period doesn’t really paint the whole story, especially for venture capital. You’ll see there was an explosion in returns during the dot com boom, but PMEs came back to earth fairly quickly after that. You’ll also see there is a huge difference between the weighted average returns and the median returns, which leads us to discuss the dispersion in returns.
Dispersion:
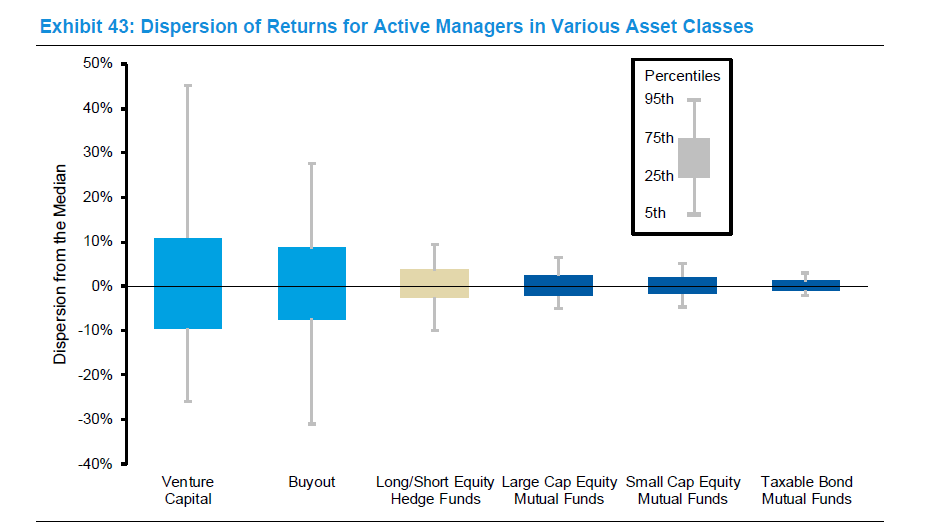
Dispersion in private markets is a very important concept to understand. As we alluded to in the previous paragraph, there seems to be a large distribution of returns, which the paper describes as the best funds driving unreal returns, but also several funds providing very mediocre or actually loss making returns. As you can see in the exhibits below, the dispersion for buyout and VC funds is significantly larger than public market funds. Part of this reason, we assume, is also because if public market funds underperform for too many years they will shut down, whereas VC and buyout funds will keep operating for the life of the fund (which can be up to 12-13 years).

That said, if you do manage to invest in one of the best VC or Buyout funds and remain able to access those funds for the future, you will actually do quite well. It seems that VC funds that are in the top quartile have a high chance of delivering high returns for their next funds too.

The paper hypothesizes that this is due to persistence, which implies that the if you’re a top-performing fund you will a get access to the best deals, and because you have access to the best deals you have a high-chance of becoming a top-performing fund (and so on and so forth). This also serves as a point of caution for investors who try and go after deals themselves. Think of it this way, if you’re seeing a deal, its likely been passed on by the VCs in the top 2-3 quartiles, so you have to ask yourself if you’ve gotten lucky and found a diamond in the rough (which is statistically unlikely) or is the deal unlikely to make you any money.
What this all implies
We started this post by talking about how we don’t do much in private markets, and that the reasons were three-fold:
Lack of Deal Flow: As we can see from the dispersion metrics and the persistence hypothesis, it’s really important that when you invest in private markets that you have access to the best deals (either directly or through funds). Unless you have this or have a way of developing a network to get this, odds are that you’re going to make a lot of loss-making investments.
Return Calculations: We’ve always been sceptical of fund returns and when comparing to PME returns it doesn’t seem that on average there is a huge pickup, especially if you account for illiquidity. In fact it seems on the median, VC funds actually underperform. Now that said if you can invest in a top quartile fund, there’s nothing like it, and returns have been quite spectacular for certain funds and certain vintages.
General Illiquidity: This is more of a personal preference, but we feel that while public markets may not provide (on average) the same returns as say buyout funds, we do like the fact that we get to change our minds if we’ve made a dog of an investment. That allows us to ensure our losses don’t get too high, and increase our odds of overall success. Further a strategy of cutting your losers and holding on to your winners is easier to implement in public markets as compared to private markets. Certainly some investors prefer the private markets as they don’t have to deal with volatility, but if you see volatility as an opportunity rather than a risk, this is a feature and not a bug of public markets.
Again, this all might sound like we think private market investing is ill-advised. That’s not at all what we’re saying, and the data does show outperformance. We simply want to show that making millions in private markets is not as easy as it might seem when you see unicorns being created every other day. The key point here is that due to dispersion of returns in private markets you’re either going to be very happy or very, very sad.
Other parts of the paper we found fascinating:
- US pensions and Endowments are switching allocation to alternative assets as returns fall below return expectations (leading to unfunded liabilities). To us, this seems to make sense, as most major endowments will get access to the best PE/VC funds and thus should double down on their allocation especially in a world where fixed income and cash will return next to nothing.

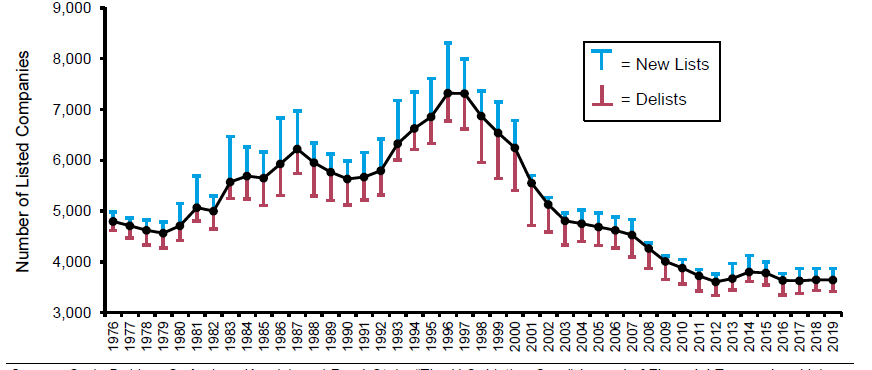
- We are starting to see many more delistings rather than listings in the US, leading to the number of total listed companies having dropped consistently since 1996. However, the main cause of this has been mergers between public companies, thus the overall reduction in assets has only been ~5% since the 1990s (still bad, but not as bad as expected).
- With companies staying private longer and receiving more funding, the value unlocking that public markets provide has potentially been missed. To put this in perspective the % of value that has been unlocked from Amazon, Google, and Facebook since they did their IPOs is 99.95%, 97%, and 85% respectively.
We hope you enjoyed reading this blog post and it helped you think just a bit harder about your asset allocation. As usual stay safe out there, and Happy Investing!
[1] Buyout and VC figures include dry-powder